Line Chart
DbFace application script.
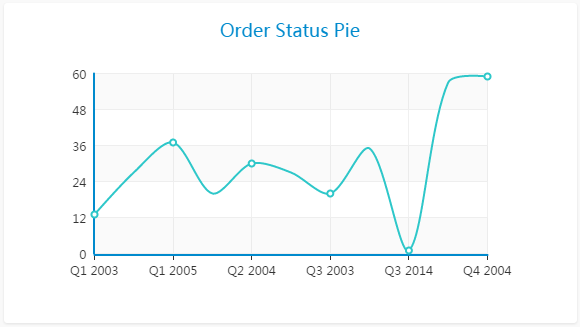
A line chart or line graph is a type of chart which displays information as a series of data points called ‘markers’ connected by straight line segments.
Here is a video that showing you how to build a chart report:
Data format
Line chart accepts two or more columns. The second through the last column must be numeric.
| Dimension (X Axis) | Measure Y-Axis | ... |
| Label 1 | Row 1 | ... |
| Label 2 | Row 2 | ... |
| Label 3 | Row 3 | ... |
| ... | ... | ... |
Feedback
Was this page helpful?
Glad to hear it! Please tell us how we can improve.
Sorry to hear that. Please tell us how we can improve.
Last modified December 28, 2020: fix (2310be7)